Paytable Depths: Analyzing Symbol Value Distributions in High-Volume Reel Games

Paytable structures in high-volume reel games reveal intricate patterns of symbol value distribution that shape overall game mathematics, and analysts track these elements closely because they determine both return percentages and player engagement metrics across thousands of spins per session. High-volume environments, where reels cycle rapidly in continuous play, amplify small differences in symbol weighting since frequency and payout tiers interact directly with reel strip lengths that often range from 20 to 50 positions per reel.
Core Components of Symbol Valuation
Each symbol carries assigned credit values listed in the paytable, yet the true distribution emerges only when frequency data combines with those values to produce expected contribution percentages, and researchers calculate this by multiplying symbol occurrence rates on each reel by the payout multiplier for every winning line combination. Low-value symbols typically occupy 30 to 40 percent of reel positions in standard five-reel configurations, while premium symbols appear in single digits, creating the layered hierarchy visible in most titles released through mid-2026.
Game studios adjust these distributions during design to meet target RTP ranges, and data compiled by the Nevada Gaming Control Board shows that approved titles maintain RTP figures between 85 and 98 percent depending on jurisdiction and operator settings. The weighting process involves iterative testing of reel strips, where engineers shift symbol counts by one or two positions and re-run simulation batches exceeding one million spins to verify stability.
Distribution Patterns Across Reel Volumes
High-volume reel games process far more outcomes per hour than traditional mechanical predecessors, which magnifies the impact of any imbalance in symbol placement, and observers note that even minor clustering of high-value symbols on adjacent reels can shift bonus trigger rates by several percentage points. In titles featuring 243 or 1024 ways-to-win mechanics, symbol distribution spreads across multiple paylines simultaneously, so value tiers must balance across expanded winning vectors rather than single fixed lines.
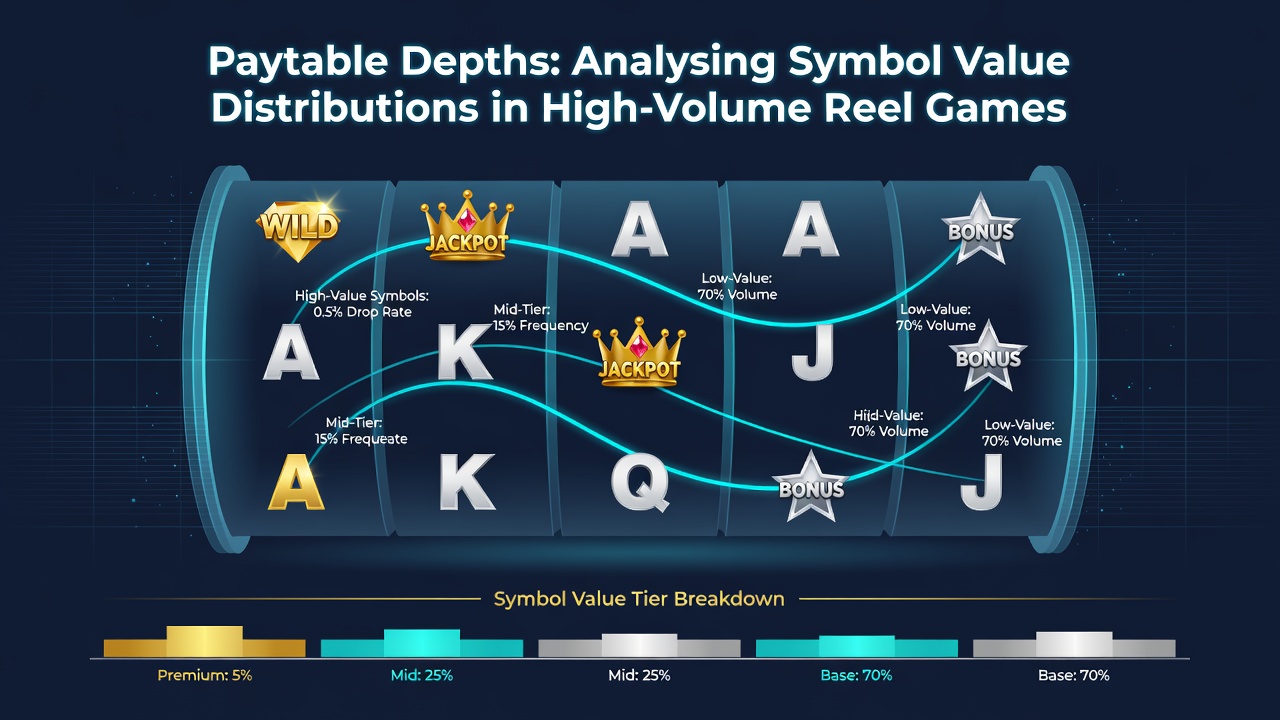
Statistical models separate symbols into base, mid-tier, and top-tier categories, then map their proportional contributions to total RTP, and one industry report from the University of Nevada Reno Gaming Research Center indicates that top-tier symbols usually account for 15 to 25 percent of overall return while appearing less than 5 percent of the time. This inverse relationship between frequency and value creates the variance profile players experience during extended sessions.
Impact of Modern Mechanics on Value Spread
Cascading and tumbling features introduced in recent years alter effective symbol distribution because winning symbols disappear and new ones fall into place, effectively resampling the reel strips multiple times per spin, and this resampling changes how often premium symbols land in consecutive cascades. June 2026 saw several providers release titles that incorporate dynamic weighting, where certain symbols gain or lose frequency based on previous outcomes within the same spin sequence.
Hold-and-respin bonuses further complicate distribution analysis because they isolate specific symbol types on the grid while freezing others, and regulators in New Jersey require full disclosure of these conditional probabilities in submission documents. The resulting paytable must account for both base game cycles and the isolated bonus cycles, each carrying distinct symbol value weightings that together produce the published RTP figure.
Analytical Tools and Verification Methods
Developers rely on Monte Carlo simulations combined with exact combinatorial calculations to map symbol value distributions, and these dual approaches cross-verify that theoretical returns align with observed results over large sample sizes, while smaller operators sometimes commission independent labs for third-party audits before market launch. Paytable depth becomes especially relevant when games scale to high-volume deployment across thousands of terminals, because cumulative deviation from expected distributions can affect operator hold percentages over time.
One study published by the Australian Gambling Research Centre examined 120 commercial titles and found that games with deeper paytable layers, meaning more distinct symbol tiers, exhibited tighter confidence intervals around their stated RTP after 500,000 spins compared with simpler three-tier structures. The additional granularity allows finer control during the final balancing phase prior to regulatory submission.
Regional Regulatory Perspectives
Authorities outside the UK apply distinct requirements for symbol disclosure and testing protocols, and the Malta Gaming Authority mandates that all reel positions and weighting tables remain available for inspection throughout the certification period. Canadian provincial regulators similarly require detailed frequency tables that list exact symbol counts per reel strip, enabling independent verification that published paytables match actual game code.
These documentation standards help ensure that value distributions remain consistent between development builds and live deployments, and any post-certification modification triggers a fresh review cycle. High-volume environments amplify the need for such transparency because aggregate player activity magnifies even fractional shifts in symbol probability.
Conclusion
Symbol value distributions within high-volume reel games represent a foundational layer of game mathematics that influences every subsequent design choice from volatility settings to bonus frequency, and continued refinement of analytical methods allows providers to maintain precise control over these elements across expanding global markets. As reel counts, ways-to-win configurations, and dynamic features evolve, the underlying paytable structures adapt through increasingly sophisticated weighting techniques that preserve both regulatory compliance and consistent performance metrics.